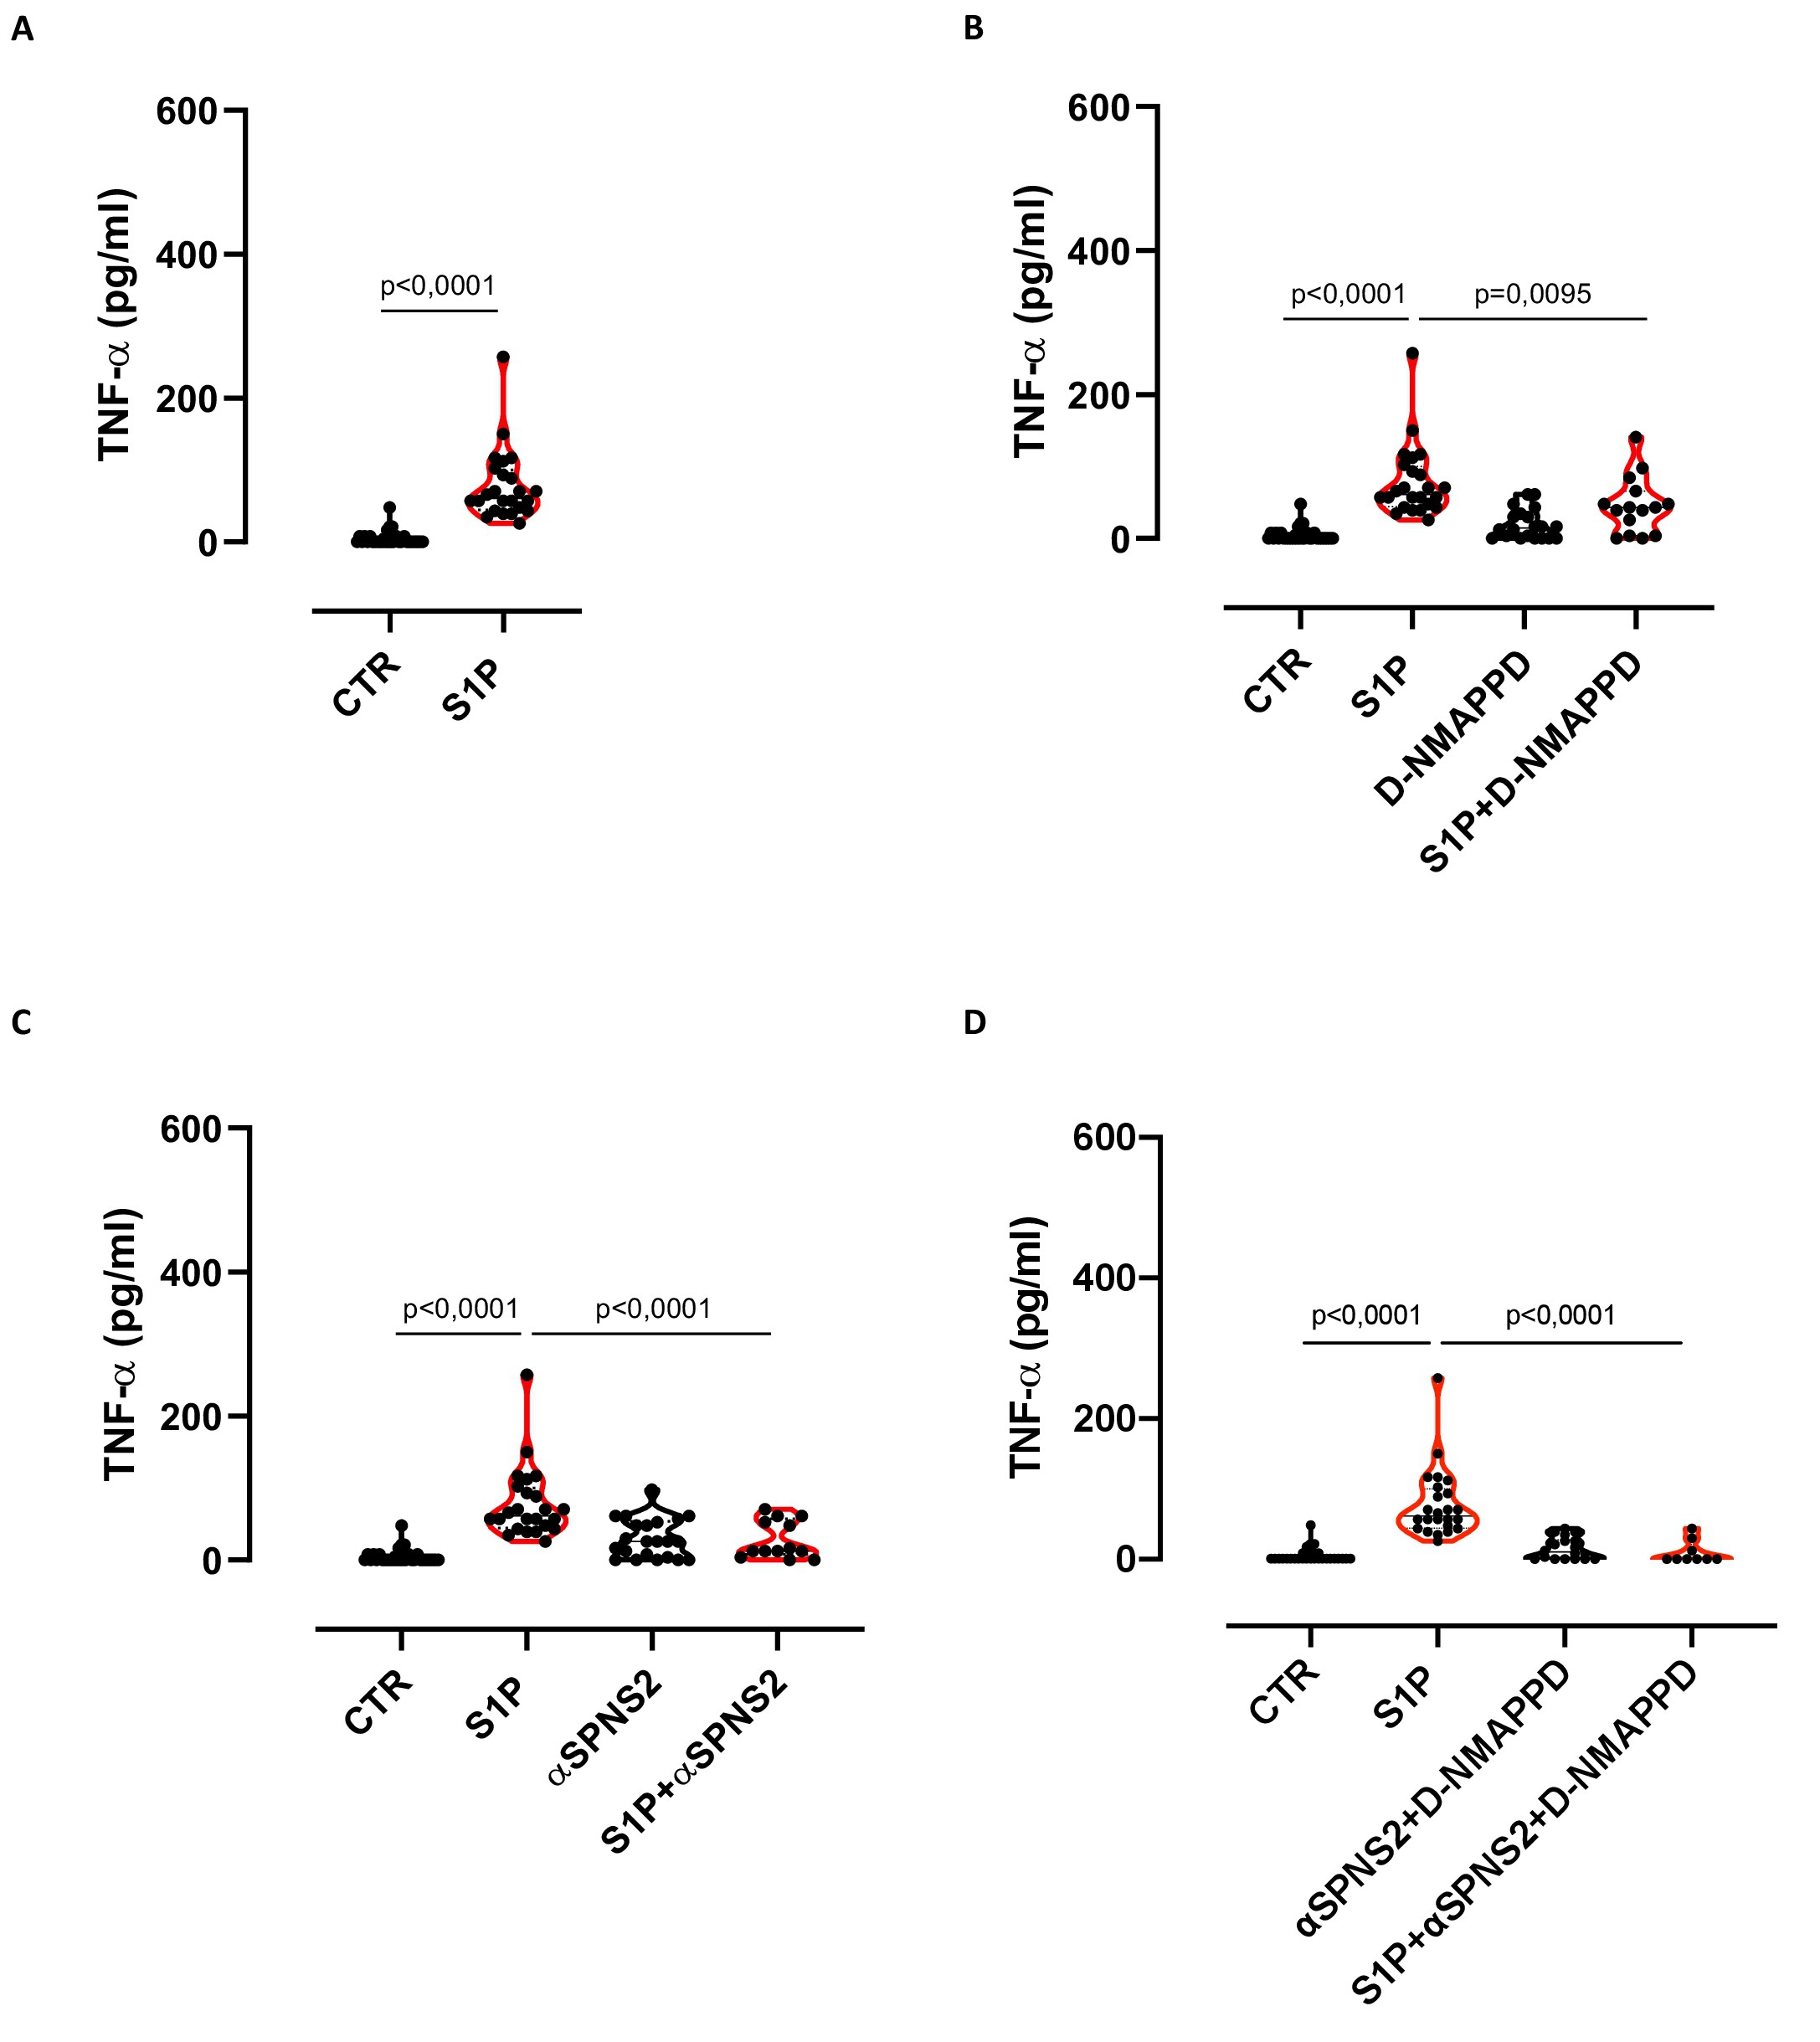
Fig. 4. S1P induces TNF-α release from A549 cells. A) S1P induced the release of TNF-α from A549 cells after 8 hours treatment. A significantly reduction of TNF-α levels was detected when ceramidase (B) or/and SPNS2 transporter (C and D) were inhibited after S1P stimulation. Data are presented as violin plot, showing the median ± interquartile range. Statistical differences were assessed with Mann-Whitney test and Ordinary ONE-Way ANOVA followed by Tukey's multiple comparison test. Ceramidase inhibitor (D-NMAPPD, 5 µM), anti-Spinster homolog 2 antibody (αSPNS2, 10 ng/ml).